
Pandas boxplot()
In this tutorial, you will learn about the boxplot() method in Pandas with the help of examples.
The boxplot() method in Pandas is used to create box plots, which are a standard way of showing the distribution of data through their quartiles.
A box plot displays the distribution of data based on a five-number summary: minimum, first quartile (Q1), median, third quartile (Q3), and maximum.
We use matplotlib.pyplot() to plot the box plot.
Example
import pandas as pd
import numpy as np
import matplotlib.pyplot as plt

# create a dataframe
data = {'Math': [88, 74, 96, 85, 91],
        'Science': [92, 80, 75, 88, 90],
        'English': [79, 84, 87, 90, 93]}

df = pd.DataFrame(data)

# create a boxplot
boxplot = df.boxplot()
plt.show()
boxplot() Syntax
The syntax of the boxplot() method in Pandas is:
df.boxplot(column=None, by=None, ax=None, fontsize=None, rot=0, grid=True, figsize=None, layout=None, return_type=None,**kwargs)
boxplot() Arguments
The boxplot() method takes the following arguments:
column(optional): specifies columns to plotby(optional): specifies columns to group byax(optional): matplotlib axes object used to place the plot on specific axes or a subplotfontsize(optional): specifies font size for the axis labelsrot(optional): specifies rotation of axis labelsgrid(optional): whether to display grid lines or notfigsize(optional): specifies size of the figure to createlayout(optional): specifies layout of the boxplotsreturn_type(optional): specifies the type of object to return**kwargs(optional): additional keyword arguments
boxplot() Return Value
The boxplot() method in Pandas can return different types of objects based on the return_type parameter. The return_type parameter specifies the type of object that should be returned. The options are:
'axes': This is the default. Whenreturn_type='axes', the method returns a Matplotlibaxesobject or a NumPy array ofaxesobjects if there are multiple subplots.
'dict': Ifreturn_type='dict', it returns a dictionary whose keys are the column names or group names (if by is specified) and whose values are dictionaries of Matplotliblinesrepresenting the various parts of the box plot.
'both': Whenreturn_type='both', it returns a named tuple with two components:axesandlines, whereaxesis as described above andlinesis a dictionary as in the'dict'return type.
None: Ifreturn_type=None, no object is returned. This might be used in situations where you only want to display the plot and do not need to interact with it programmatically afterward.
Example 1: Simple Box Plot
import pandas as pd
import numpy as np
import matplotlib.pyplot as plt

# create a dataframe
data = {'Math': [88, 74, 96, 85, 91],
        'Science': [92, 80, 75, 88, 90],
        'English': [79, 84, 87, 90, 93]}

df = pd.DataFrame(data)

# create a boxplot
boxplot = df.boxplot(column=['Math'])
plt.show()
Output
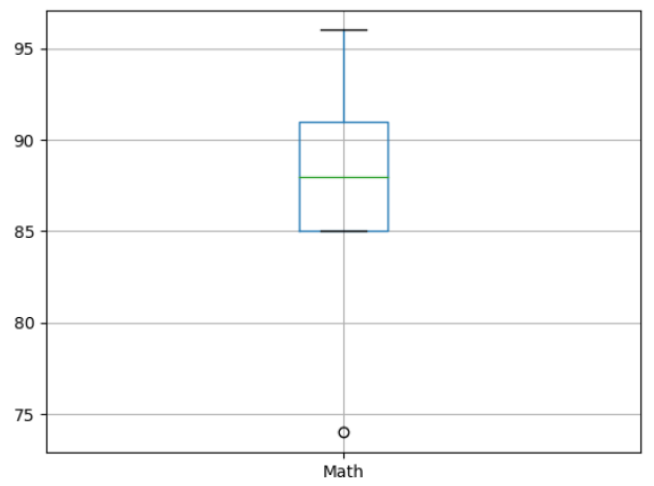
In this example, we plotted a simple box plot for the Math column.
Example 2: Box Plot Grouped by Subject
import pandas as pd
import numpy as np
import matplotlib.pyplot as plt

# create a dataframe
data = { 'Scores': [88, 74, 96, 91, 92, 80, 88, 90, 79, 87, 90, 93, ],
        'Subject': ['Maths', 'Maths', 'Maths', 'Maths', 'Science', 'Science', 'Science', 'Science', 'English', 'English', 'English', 'English']}

df = pd.DataFrame(data)

# create a boxplot grouped by subject
boxplot = df.boxplot(column=['Scores'], by='Subject')
plt.show()
Output
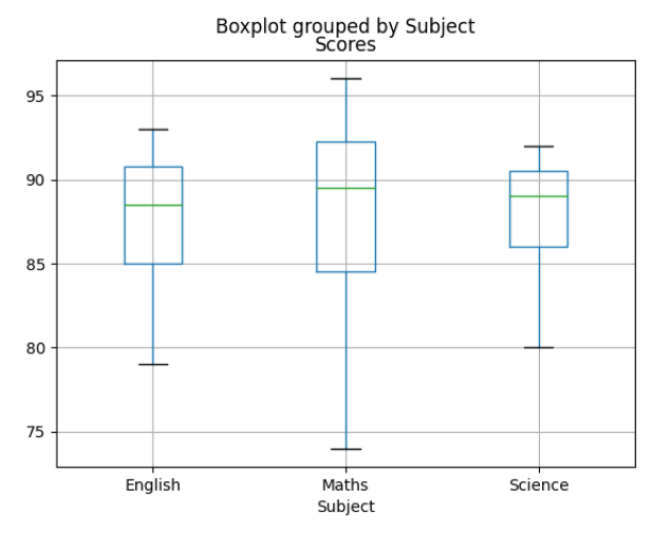
In this example, we used the by argument to group the Scores column by Subject before plotting the box plot.
Example 3: Customizing Box Plots
import pandas as pd
import numpy as np
import matplotlib.pyplot as plt

# create a dataframe
data = {'Math': [88, 74, 96, 85, 91],
        'Science': [92, 80, 75, 88, 90],
        'English': [79, 84, 87, 90, 93]}

df = pd.DataFrame(data)

# create a boxplot grouped by subject
boxplot = df.boxplot(column=['Math'], grid=False, rot=45, fontsize=15, figsize=(8,6))
plt.show()
Output
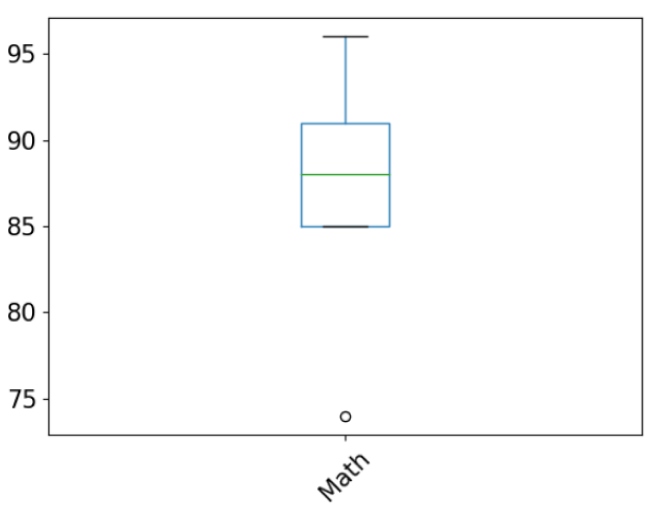
In this example, we customized the box plot for the Math column.
Here,
grid=False: means that the grid lines are not shownrot=45: rotates the label by 45 degreesfontsize=15: sets the font size of labels to 15figsize=(8,6): sets the size of the plot to 8x6 inches
Example4: Pandas boxplot() Return Type
import pandas as pd

# create a dataframe
data = {
    'A': [1, 2, 3, 4, 5],
    'B': [2, 3, 4, 5, 6],
    'C': [3, 4, 5, 6, 7]
}

df = pd.DataFrame(data)

# create a box plot of the data
# with dict return type
plot_dict = df.boxplot(return_type='dict')

print(plot_dict)
Output
{
'whiskers': [<matplotlib.lines.Line2D object at 0x117bf3710>, <matplotlib.lines.Line2D object at 0x117d936d0>, <matplotlib.lines.Line2D object at 0x117da7d10>, <matplotlib.lines.Line2D object at 0x117db4890>, <matplotlib.lines.Line2D object at 0x117dc0a90>, <matplotlib.lines.Line2D object at 0x117dc1610>],
 'caps': [<matplotlib.lines.Line2D object at 0x117da4310>, <matplotlib.lines.Line2D object at 0x117da5010>, <matplotlib.lines.Line2D object at 0x117db53d0>, <matplotlib.lines.Line2D object at 0x117db5f50>, <matplotlib.lines.Line2D object at 0x117dc21d0>, <matplotlib.lines.Line2D object at 0x117dc2d90>],
'boxes': [<matplotlib.lines.Line2D object at 0x117d64390>, <matplotlib.lines.Line2D object at 0x117da71d0>, <matplotlib.lines.Line2D object at 0x117db7f10>],
'medians': [<matplotlib.lines.Line2D object at 0x117da5bd0>, <matplotlib.lines.Line2D object at 0x117db6b10>, <matplotlib.lines.Line2D object at 0x117dc3850>],
'fliers': [<matplotlib.lines.Line2D object at 0x117da6250>, <matplotlib.lines.Line2D object at 0x117db7450>, <matplotlib.lines.Line2D object at 0x117dcc310>],
'means': []
}
In this example, we returned the box plot as a Python dictionary. This is useful when we want to interact with the box plot programmatically after creating it.