
NumPy log()
In this tutorial, you will learn about the numpy.log() method with the help of examples.
The numpy.log() function is used to calculate the natural logarithm of the elements in an array.
Example
import numpy as np

# create a NumPy array
array1 = np.array([1, 2, 3, 4, 5])

# calculate the natural logarithm
# of each element in array1
result = np.log(array1)

print(result)

# Output: [0.         0.69314718 1.09861229 1.38629436 1.60943791]
log() Syntax
The syntax of the numpy.log() method is:
numpy.log(array)
log() Arguments
The numpy.log() method takes one argument:
array- the input array
log() Return Value
The numpy.log() method returns an array that contains the natural logarithm of the elements in the input array.
Example 1: Use of log() to Calculate Natural Logarithm
import numpy as np

# create a 2-D array
array1 = np.array([[0.5, 1.0, 2.0, 10.0],
                                [3.4, 1.5, 6.8, 4.12]])

# calculate the natural logarithm
# of each element in array1
result = np.log(array1)

print(result)
Output
[[-0.69314718  0.          0.69314718  2.30258509]
 [ 1.22377543  0.40546511  1.91692261  1.41585316]]
Here, we have used the np.log() method to calculate the natural logarithm of each element in the 2-D array named array1.
The resulting array result contains the natural logarithm values.
Example 2: Graphical Representation of log()
To provide a graphical representation of the logarithm function, let's plot the logarithm curve using matplotlib, a popular data visualization library in Python.
To use matplotlib, we'll first import it as plt.
import numpy as np
import matplotlib.pyplot as plt

# generate x values from 0.1 to 5 with a step of 0.1
x = np.arange(0.1, 5, 0.1)

# compute the logarithmic values of x
y = np.log(x)

# plot the logarithmic curve
plt.plot(x, y)
plt.xlabel('x')
plt.ylabel('log(x)')
plt.title('Logarithmic Function')
plt.grid(True)
plt.show()
Output
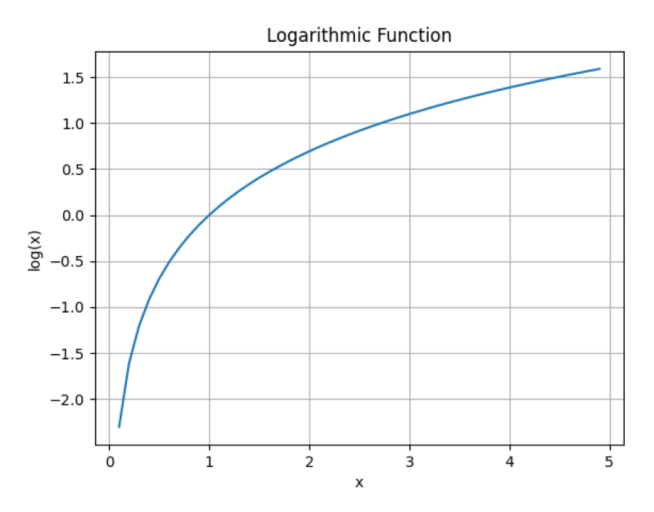
In the above example, we plot the x array on the x-axis and the y array, which contains the natural logarithm values, on the y-axis using plt.plot(x, y).