
NumPy meshgrid()
In this tutorial, you will learn about the numpy.meshgrid() method with the help of examples.
The meshgrid() method takes two or more 1D arrays representing coordinate values and returns a rectangular grid of a pair of 2D arrays.
Example
import numpy as np

# 1D arrays as x and y coordinates
x = np.array([1, 2, 3])
y = np.array([10, 20])

# create a 2D grid using meshgrid
X, Y = np.meshgrid(x, y)

# print the created grid
print("X values:\n", X)
print("\nY values:\n", Y)

'''
Output:
X values:
[[1 2 3]
 [1 2 3]]

Y values:
 [[10 10 10]
 [20 20 20]]
'''
Given two arrays x and y, meshgrid() returns an array of all possible coordinate points (xi, yi) for all xi in x and yi in y.
meshgrid() Syntax
The syntax of meshgrid() is:
numpy.meshgrid(*xi, copy = True, sparse = False, indexing = 'xy')
meshgrid() Argument
The meshgrid() method takes the following arguments:
*xi- 1D arrays representing the coordinates of a gridindexing(optional)- specifies index of the grid ('xy'(Cartesian, default) or'ij'(matrix) )sparse(optional)- aboolvalue, ifTruea sparse grid is returnedcopy(optional)- create a copy ifTrue(default) and return view ifFalse
meshgrid() Return Value
The meshgrid() method returns coordinate matrices from coordinate vectors.
Example 1: Create a 2-D Grid
import numpy as np

# create 1D arrays
x = np.array([1, 2, 3])
y = np.array([1, 2, 3])

# create a 2D grid using meshgrid
X, Y = np.meshgrid(x, y)

# print the created grid
print("X values:\n", X)
print("Y values:\n", Y)
Output
X values:
[[1 2 3]
 [1 2 3]
 [1 2 3]]
Y values:
 [[1 1 1]
 [2 2 2]
 [3 3 3]]
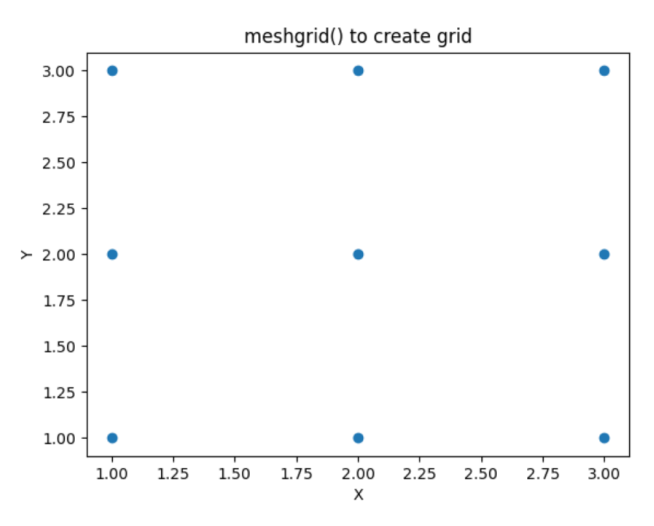
The code creates a 2D grid where the values of X and Y represent the coordinates of the grid points.
The X array represents the x-coordinates of the grid points, where each row contains the same x values [1, 2, 3]. The Y array represents the y-coordinates of the grid points, where each column contains the same y values [1, 2, 3].
To visualize the result of meshgrid(), we can use matplotlib.
import numpy as np
import matplotlib.pyplot as plt

# create 1D arrays
x = np.array([1, 2, 3])
y = np.array([1, 2, 3])

# create a 2D grid using meshgrid
X, Y = np.meshgrid(x, y)

# create a scatter plot
plt.scatter(X, Y)

# set labels and title
plt.xlabel('X')
plt.ylabel('Y')
plt.title('meshgrid() to create grid')

# show the plot
plt.show()
Output
Example 2: Index in a 2-D Grid
In NumPy's meshgrid() method, the indexing parameter allows you to specify the indexing scheme used.
meshgrid() has two indexing options: 'xy' and 'ij'.
In the xy indexing approach, the first index refers to the row (y-coordinate) and the second index refers to the column (x-coordinate).
In the ij indexing approach, the first index refers to the column (i-coordinate) and the second index refers to the row (j-coordinate)
Lets look at an example.
import numpy as np

# create 1D arrays
x = np.array([1, 2, 3])
y = np.array([10, 20])

# using xy indexing in meshgrid
XX, YY = np.meshgrid(x, y, indexing='xy')
print("Using xy indexing:")
print("XX values:\n", XX)
print("YY values:\n", YY)
print()

# using ij indexing in meshgrid
XX, YY = np.meshgrid(x, y, indexing='ij')
print("Using ij indexing:")
print("XX values:\n", XX)
print("YY values:\n", YY)
Output
Using xy indexing:
XX values:
[[1 2 3]
 [1 2 3]]
YY values:
 [[10 10 10]
 [20 20 20]]

Using ij indexing:
XX values:
 [[1 1]
 [2 2]
 [3 3]]
YY values:
 [[10 20]
 [10 20]
 [10 20]]
With indexing='xy', the first array XX corresponds to the x-coordinates and the second array YY corresponds to the y-coordinates.
With indexing='ij', the first array XX corresponds to the i-coordinates and the second array YY corresponds to the j-coordinates.
Example 3: Using sparse Argument in meshgrid
You can create sparse output arrays to save memory and computation time.
import numpy as np

# create 1D arrays
x = np.array([1, 2, 4])
y = np.array([10, 20, 30, 40])

# create a  grid
XX, YY = np.meshgrid(x, y)
print("Grid: ")
print("XX values:\n", XX)
print("YY values:\n", YY)

# create a sparse grid
XX, YY = np.meshgrid(x, y, sparse=True)
print("Sparse Grid: ")
print("XX values:\n", XX)
print("YY values:\n", YY)
Output
Grid:
XX values:
[[1 2 4]
 [1 2 4]
 [1 2 4]
 [1 2 4]]
YY values:
 [[10 10 10]
 [20 20 20]
 [30 30 30]
 [40 40 40]]

Sparse Grid:
XX values:
 [[1 2 4]]
YY values:
 [[10]
 [20]
 [30]
 [40]]
Related topics:
ogrid(): A NumPy function that creates a sparse multi-dimensional grid of values after you specify the start, stop, and step values for each dimension.
mgrid(): A NumPy function that creates a dense multi-dimensional grid of values after you specify the start, stop, and step values for each dimension.
Let's look at an example.

import numpy as np

# using mgrid to create a dense multi-dimensional grid
mGridX, mGridY = np.mgrid[0:10:2, 0:5]

print('For mgrid,')
print('X values:\n', mGridX)
print('Y values:\n', mGridY)

# using ogrid to create an open multi-dimensional grid
oGridX, oGridY = np.ogrid[0:10:2, 0:5]

print('\nFor ogrid,')
print('X values:\n', oGridX)
print('Y values:\n', oGridY)
Output
For mgrid,
X values:
[[0 0 0 0 0]
 [2 2 2 2 2]
 [4 4 4 4 4]
 [6 6 6 6 6]
 [8 8 8 8 8]]
Y values:
 [[0 1 2 3 4]
 [0 1 2 3 4]
 [0 1 2 3 4]
 [0 1 2 3 4]
 [0 1 2 3 4]]

For ogrid,
X values:
[[0]
 [2]
 [4]
 [6]
 [8]]
Y values:
 [[0 1 2 3 4]]